
Out of Africa into the world: Palm oil trade under global value chain and sustainable initiatives

With a History dating back 5000 years, palm oil has come to be the most consumed, produced and trade type of vegetable around the world. It is regarded as an inexpensive value choice for vegetable oil food use and has wide applications to various downstream industries such as cosmetics products production.
Today, Southeast Asia countries, predominantly Indonesia and Malaysia the largest supplying region; while the consuming markets are widespread around the world by all major economies, both developing and developed countries, so it might come as a surprise to find out that palm oil originated in West Africa before and was only introduced into Malaysia about a century ago.
With trade data we may track the global view of where and how much palm oil are flow in and out, even down to specific locations and understand the traffic volume. Palm oil usually could be transported via container or bulk carriers – which means carriers in both markets shall have the catchment of this commodity cargo.
Trade Overview
According to Global Trade Atlas (GTA) data reported by individual reporters, in 2019, global palm oil (HS 1511) export exceed 50 million tonnes; exports are largely dominated by the southeast Asia region with Indonesia and Malaysia as the top exporters – together contributed around 44 million tonnes. On the demand side, while palm oil largest consuming markets are held by India and China, with 9.7 million and 7.6 million tonnes imported respectively. It is also largely imported into America and Europe.
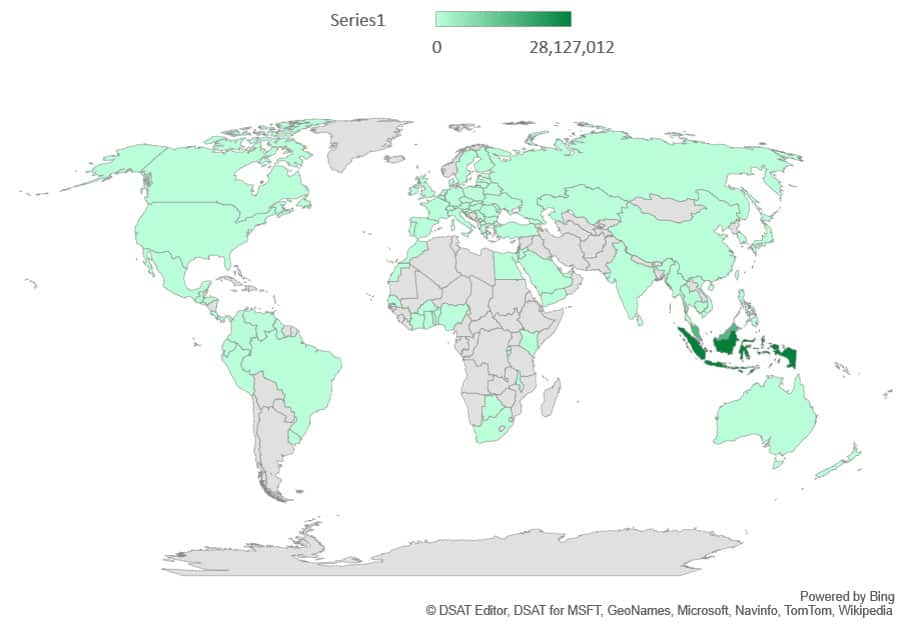
Figure 1: World Palm Oil Export Volume (2019) HS Code 1511 Source: IHS Markit Global Trade Atlas
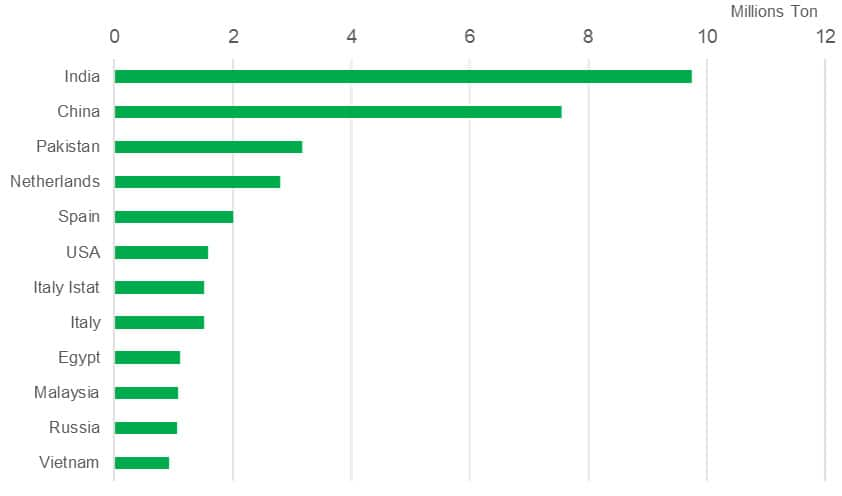
Figure 2: Top Importer by Volume (2019)
The strong export and trade to some extent reflected the production and demand of palm oil in that year, when global palm oil production in 2018/19 grew and exceeded 74 million metric tons in large part assisted by a neutral El Niño-Southern Oscillation (ENSO) index. The amply supplied palm oil market lent itself to more competitive pricing in that year, keeping food and industrial uses of palm oil to expand. (Source: IHS Markit Agriculture Industry Analysis, Nov 2020)
With GTA’s statistics detailed commodity level, we may observe more granular to see the movements of supply and demand in addition to global mega trends. While palm oil remains an important commodity in our daily life as well industry production, the trade of HS1511 i.e. raw palm oil, shows a sign of decrease in terms of trade value. At the same time, Indonesia and Malaysia remains the dominate supply. This reflects the fact that globally the majority of palm oil plantations are in Indonesia and Malaysia. Yet countries in the America, i.e Guatemala and Colombia are emerging as exporting markets while European major exporters (Netherlands and Germany, who at the same time re-export palm oil after processing, more details by looking at breakdown HS levels) have seen slower growth.
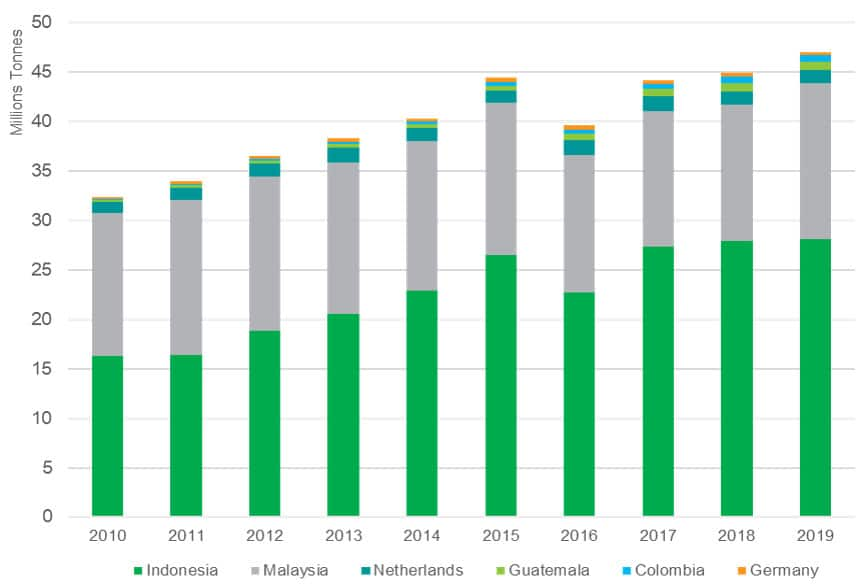
Figure 3: Top Exporter in the last Decade
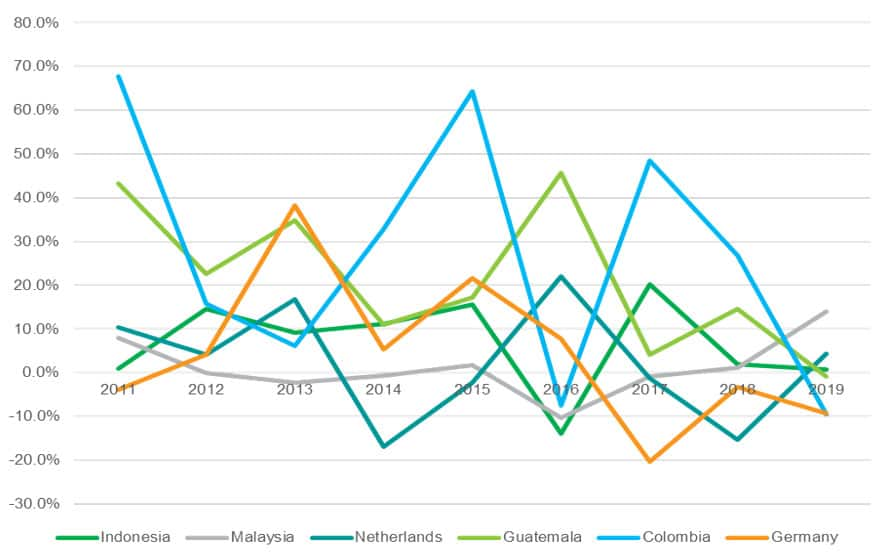
Figure 4: Export Growth in the last Decade Source: IHS Markit Global Trade Atlas
On the demand side, imports are more evenly distributed comparing to exports. Interestingly if comparing to export markets, Netherlands and Malaysia are also exporting palm oil (HS 1511) which leads the question, that these countries are actually forming a ‘processing hub’ of palm oil value chain.
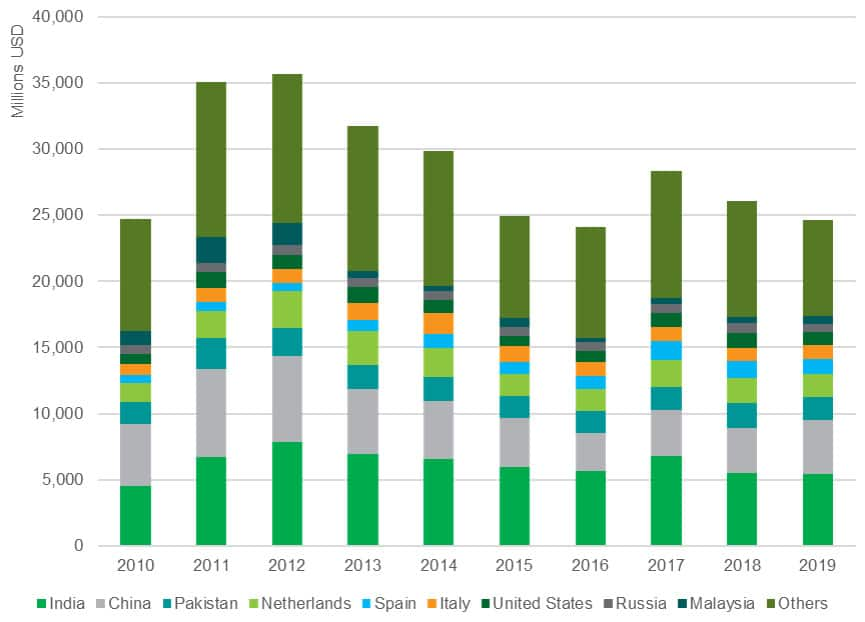
Figure 5: Top Palm Oil Importers in the last Decade
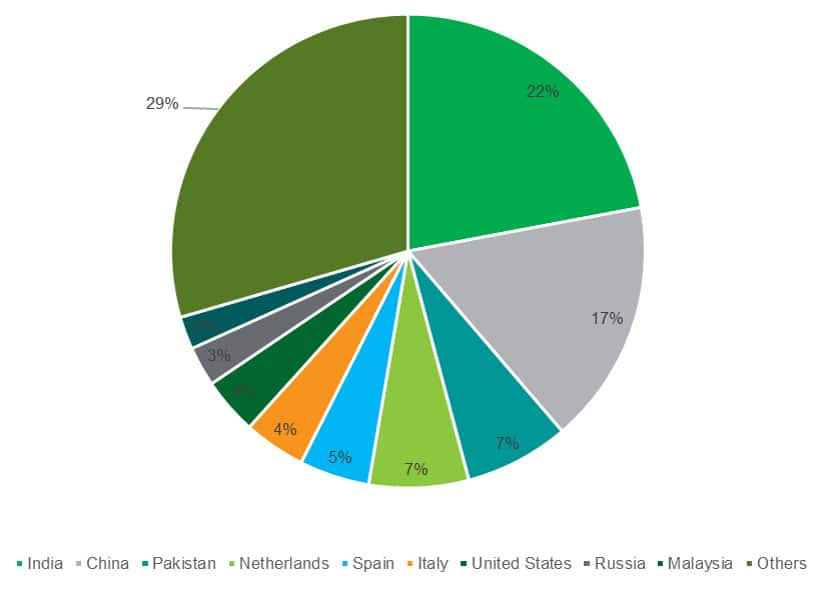
Figure 6: Top Importers Share in 2019
Observation by Region
We could further zoom into key geographic markets for a deeper analysis from regional and sector perspectives. Nevertheless, the price and the structure of palm oil trade still varied by region. Also new markets are emerging as sources for example South America and Africa. We may observe from trade statistics of the crude and refined trade which may reflects a local palm oil processing industry, re-export and therefore wider implication on value chain. In this regard and considering that the variety of application palm oil has, further analysis could be derived to uncover the mid-product and end-product sectors.
Asia: Dominant supply and demand boost regional trade
India remained as the top importers in Asia for palm oil in the past decade, except in 2019 when China experienced a significant increase in imports – possibly as some news speculated as a substitute of oil source to soy beans due to trade conflict with the US. On the supply side, Indonesia and Malaysia are competing in the market share of palm oil exports, with the current leading position taken over by Indonesia in recent years except 2016 when factors from El Nino and Indonesia Domestic consumption twinned.
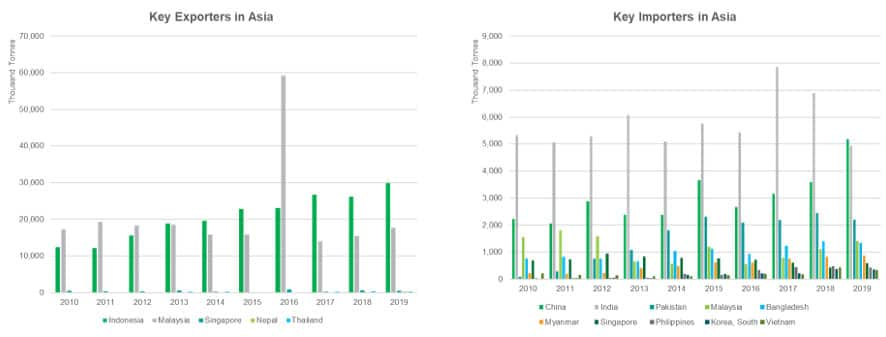
Figure 7: Key Importers and Exporters in Asia
Europe: Palm Oil Processing Focused
In Europe, the Netherlands tops both the exporter and importer billboard. Yet the imports appears to be more diverse. When looking at trade of those largest participants at a more granular level (i.e. HS 6), we may capture different trade patterns, or further the potential economic implications to that nation. For example, countries such as Netherlands and Germany import a lot crude oil but also heavily export refined products – which may imply a processing value within the market.
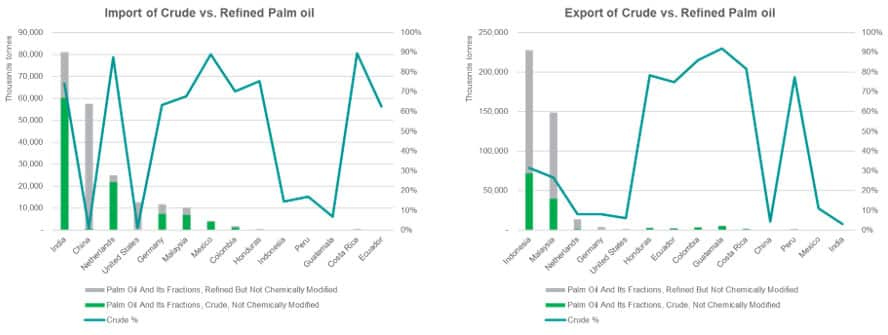
Figure 8: Crude and Refined Trade in Europe Source: IHS Markit Global Trade Atlas
Americas: Emerging Supply Market
Within America, there has been an increase in palm oil trade from Colombia, Ecuador and Guatemala. It’s worth noticing that Guatemala emerged in recent years as a large exporting country of palm oil – which has also been captured in Figure 4 above.
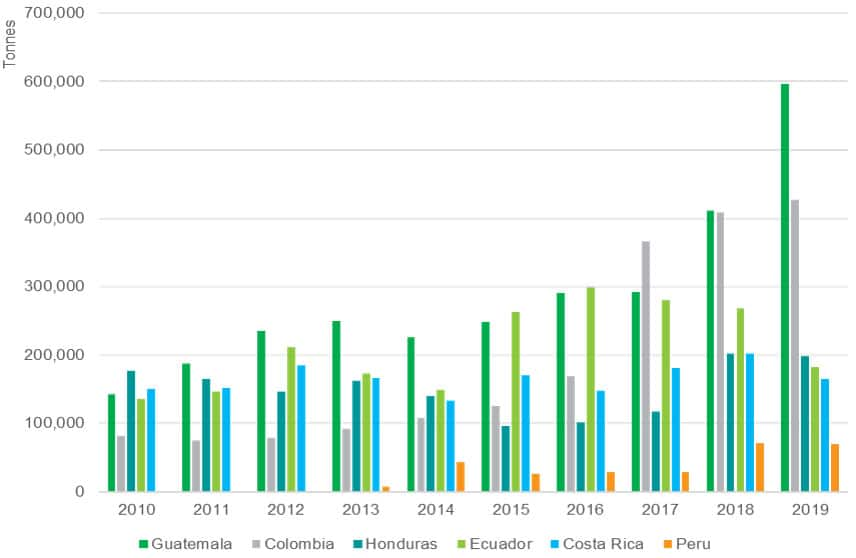
Figure 9: Emerging Exporters in Americas Source: IHS Markit Global Trade Atlas
Country-Level Analysis: Indonesia
In a highly concentrated supply market that’s driven by only a few exporters palm oil apparently is one of the pillar industries in the top players, predominantly Indonesia and Malaysia’s economies and trade. Take the No.1 exporter, Indonesia, for example, with GTA Extra Data Fields we may breakdown its export by province to look at where crude and refined products are shipping out respectively.
Palm oil brings significant maritime traffic demand on various trade routes. While the majority of trade from Indonesia is intra-Asia, With GTA’s unit measure conversion, the estimated TEU volume in 2019 heading for China and India amount to 349K and 308K TEUs while North America (US) would generate about 68K TEU marine traffic. Top exporting location in Indonesia is Dumai – with an annual volume equivalent to circa 1.61 million TEUs.
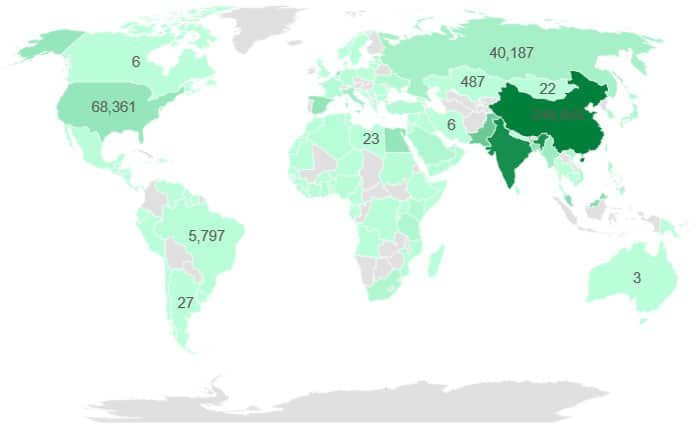
Figure 10: Palm Oil Trade Partners Indonesia Exports
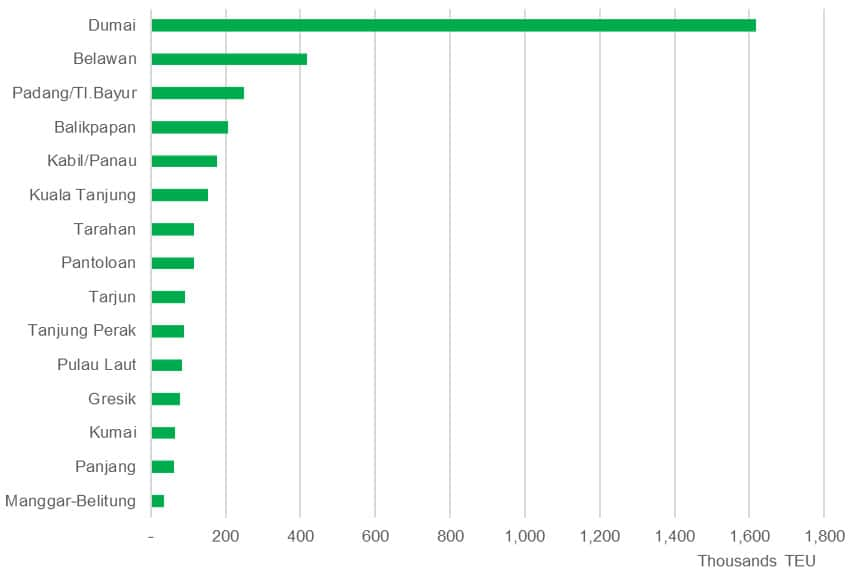
Figure 11: Top Indonesia Ports Exporting Palm Oil Source: IHS Markit Global Trade Atlas – EDF Module
Looking at the origin provinces in Indonesia that export palm oil at the breakdown level for crude and refined palm oil respectively. Riau province tops both crude and refined palm oil in terms of export volume in 2019; while Sumatera Barat, though only ranked third, but had a much narrower gap between the two types of commodities.
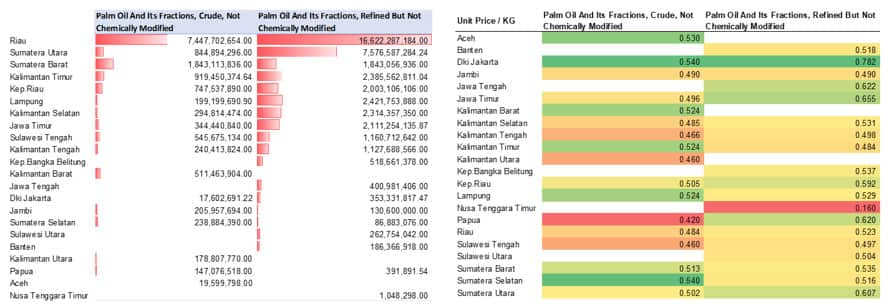
Figure 12: Volume and Unit Price by Province Source: IHS Markit Global Trade Atlas – EDF Module
Pricing is another important factor that to an extent links to regional output. It is also important for those who provide agri-related trade finance firms to understand the reasonable price of the commodity in the year. For corporate ethical procurement team, this may also be alternative information for evaluating the ‘sustainability’ potential of that exporting origin.
Movements in Palm Oil Trade
Beyond trade itself, now palm oil is not only a commodity that’s driving price dialogues, but also on thesustainability agenda. Using actual trade data and the unit price movements, could help generate a view of how particular commodity related ESG initiatives are carried out.
Despite that palm oil is an important source for downstream industries and consumer products, palm oil production is a source of growth and employment but also faces challenges concerning deforestation, biodiversity loss, greenhouse gas emissions, and water management. The EU has voted to phase out the use of palm oil as biodiesel, and the sustainability initiatives from RSPO also expanding. ESG compliance is also driving palm oil trade. GTA Forecasting with macro-factors built into model provide a long-term outlook for trade and transport. With the result we may say palm oil trade will still grow but at a moderate rate, with South and Central America gradually building up its position in the total supply market.
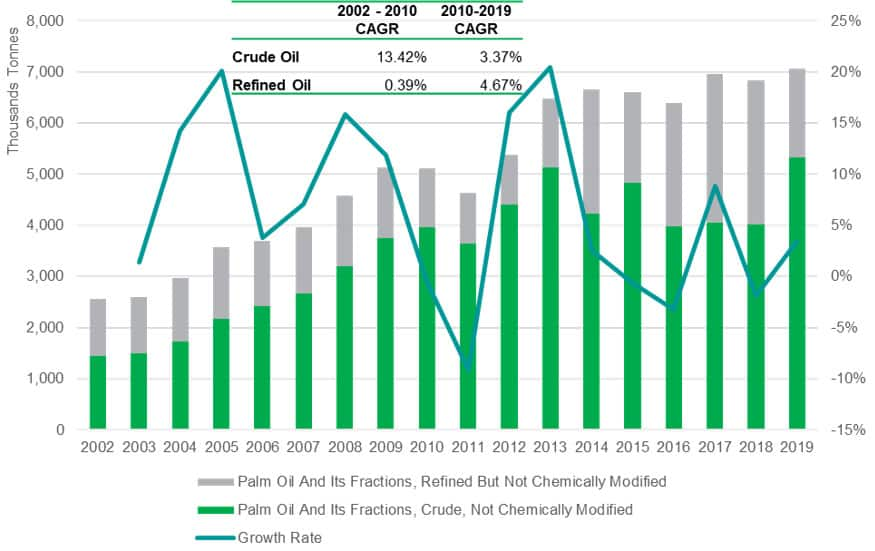
Figure 13: EU Import Development
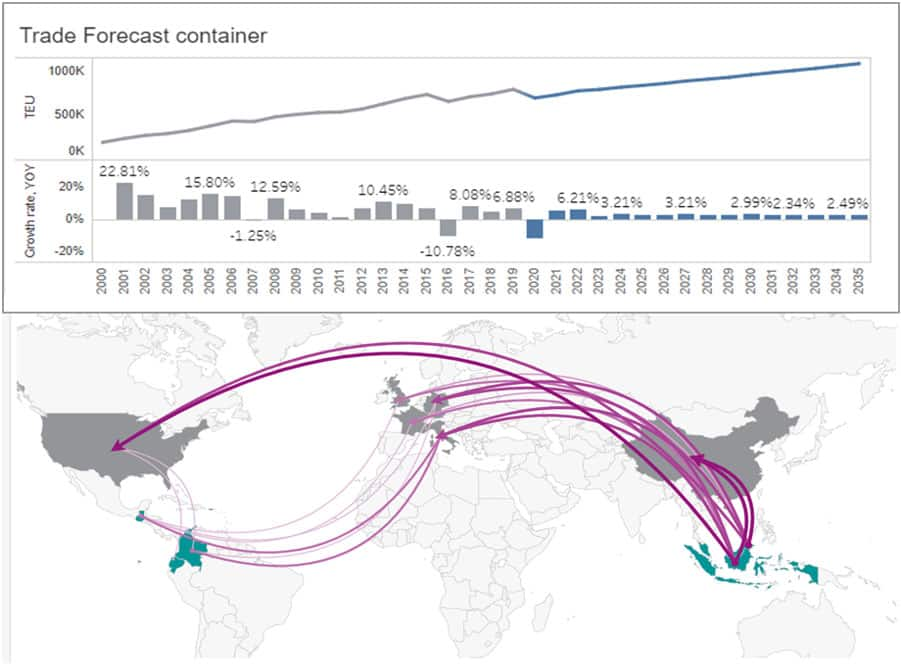
Figure 14: Palm Oil Trade Forecast – Traffic and Routes Source: IHS Markit Global Trade Atlas – GTA Forecasting
Implications
As an economic agriculture product and a widely applicable consumption necessity, palm oil plantations and trade bring profitable businesses that benefit local economies, while brought transport demand. Along the value chain, downstream processing industry may further stimulate local developments. Yet its output is largely impacted by climate, while negative impact from over plantation could offset some of the pure benefits under the sustainable development agenda goals. With these various dynamic factors, public and private stakeholders will need to closely follow the movements of the supply chain, one way is to get insight by following the movements of trade.
- Government / Trade Department: To check the trade volume against the number of issued ‘certification’ required for sustainable
- Corporates Procurement and Traders: Follow supply and demand dynamics and specific locations; procure sustainable palm oil to support ESG programme; find alternative markets of supply for business contingency planning; total cost comparison between different markets. (e.g. food manufacturing, cosmetics, other consumer products)
- Freight Providers and Landside logistics: Estimate the volume of traffic demand and what trade routes to focus; capital investment (specialised warehouse, forklift, lorries etc.)
- Finance: Understand commodity price when evaluation and granting trade finance solutions to specific regional traders.
3rd party ESG auditors: As ESG indicator emerge a metric to evaluate corporate performance, trade data could be used as an alternative resource to verify against the claim sustainable production.
Source: IHS Markit


